Figure 1
Download original image
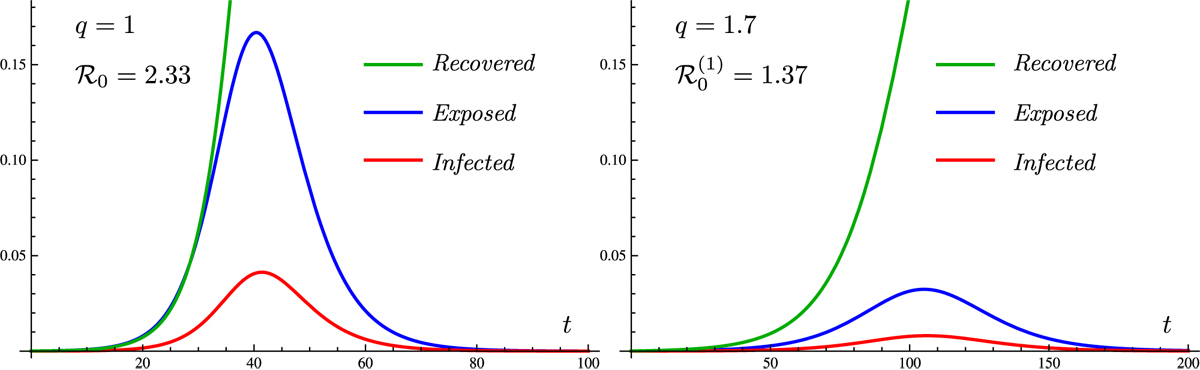
The peak of the outbreak in the SEIR model. The time t is counted in days. The vertical axis represents the fraction of the population. The basic reproduction ratio is either
![]() (left) or 1.37 (right) corresponding to a reduction of social interactions by a factor q = 1.7 as in [5]. This illustrates the flattening of the curves.
(left) or 1.37 (right) corresponding to a reduction of social interactions by a factor q = 1.7 as in [5]. This illustrates the flattening of the curves.
Current usage metrics show cumulative count of Article Views (full-text article views including HTML views, PDF and ePub downloads, according to the available data) and Abstracts Views on Vision4Press platform.
Data correspond to usage on the plateform after 2015. The current usage metrics is available 48-96 hours after online publication and is updated daily on week days.
Initial download of the metrics may take a while.