Figure 2
Download original image
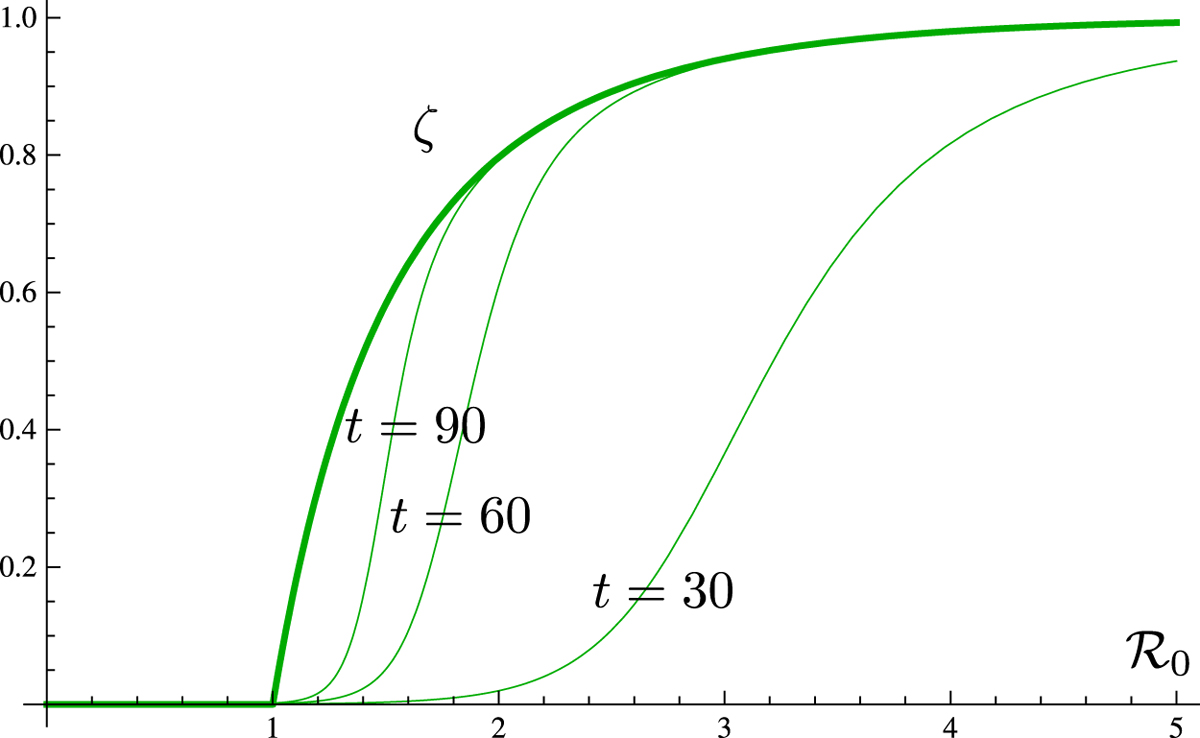
The epidemic size ζ
as a functionof the basic reproduction ratio ![]() in the simplest SEIR model corresponding to (2.6)–(2.9) exhibits a clear phase transition at
in the simplest SEIR model corresponding to (2.6)–(2.9) exhibits a clear phase transition at
![]() (thick curve). The other curves represent r(t) taken for t =30, 60, 90, for which equilibrium is not yet achieved. In practice, varying
(thick curve). The other curves represent r(t) taken for t =30, 60, 90, for which equilibrium is not yet achieved. In practice, varying ![]() is achieved by acting on the q
factor in (2.25)–(2.28).
is achieved by acting on the q
factor in (2.25)–(2.28).
Current usage metrics show cumulative count of Article Views (full-text article views including HTML views, PDF and ePub downloads, according to the available data) and Abstracts Views on Vision4Press platform.
Data correspond to usage on the plateform after 2015. The current usage metrics is available 48-96 hours after online publication and is updated daily on week days.
Initial download of the metrics may take a while.