Figure 4
Download original image
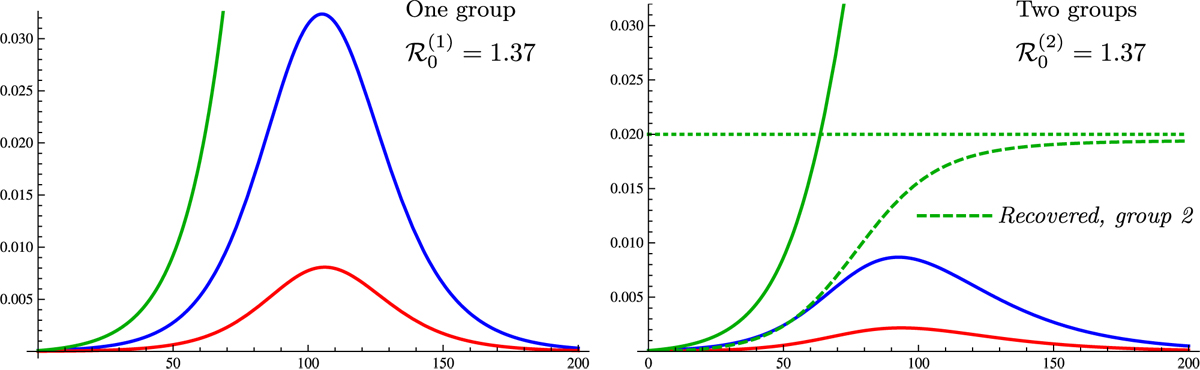
Model with a single group (left) and q = 1.7 corresponding to a basic reproduction ratio of 1.37, and two groups (right) with q1 = 2.35, q2 = 0.117, and p = 0.02 as in Figure 3, with same basic reproduction ratio. Note that the figure on the left is the same as in Figure 1 (right), on a different scale. The straight dotted line is the level p. In the case with two groups, note that almost all individuals of the second group get infected during the propagation of the disease.
Current usage metrics show cumulative count of Article Views (full-text article views including HTML views, PDF and ePub downloads, according to the available data) and Abstracts Views on Vision4Press platform.
Data correspond to usage on the plateform after 2015. The current usage metrics is available 48-96 hours after online publication and is updated daily on week days.
Initial download of the metrics may take a while.