Figure 5
Download original image
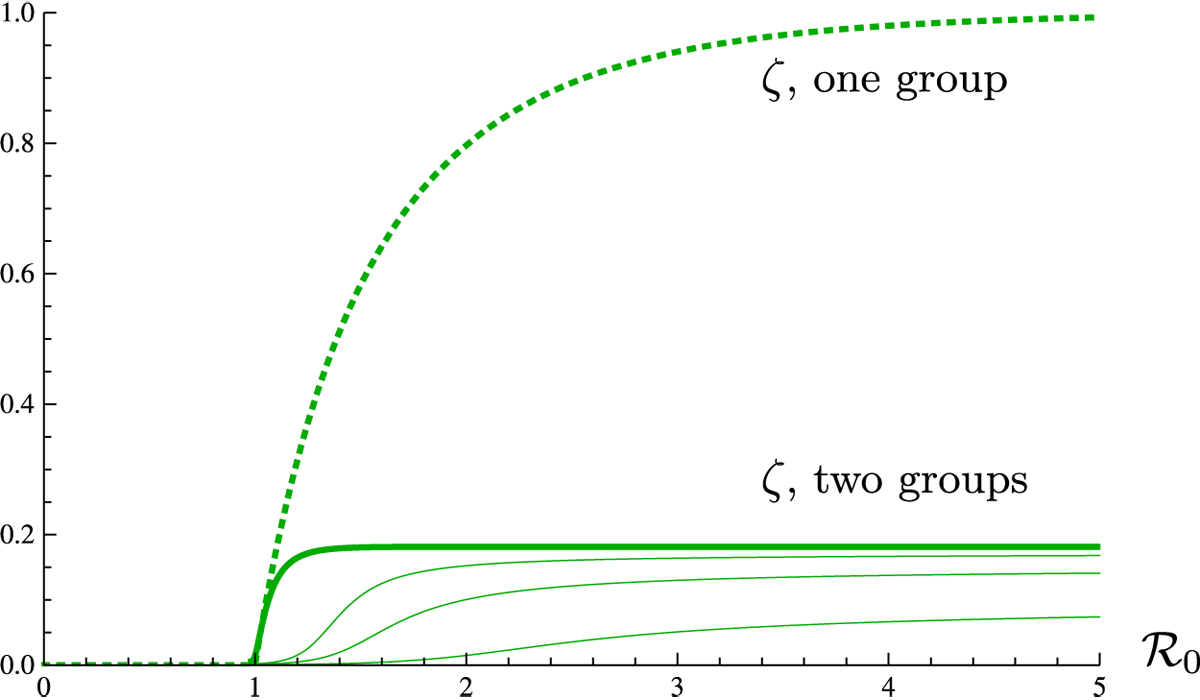
The epidemic size in a population with one group (dotted curve, same as in Fig. 2) or two groups (plain, thick curve) with ![]() and p = 0.02 as a function of the basic reproduction ratio (obtained by varying q in the first case and q2 in the second case). The other lines correspond to simulations of r(t) for t = 30, 60, 90 in the model with two groups. With two groups, we recover a phase transition as in Figure 2, corresponding to q2 ≈ 0.96.
and p = 0.02 as a function of the basic reproduction ratio (obtained by varying q in the first case and q2 in the second case). The other lines correspond to simulations of r(t) for t = 30, 60, 90 in the model with two groups. With two groups, we recover a phase transition as in Figure 2, corresponding to q2 ≈ 0.96.
Current usage metrics show cumulative count of Article Views (full-text article views including HTML views, PDF and ePub downloads, according to the available data) and Abstracts Views on Vision4Press platform.
Data correspond to usage on the plateform after 2015. The current usage metrics is available 48-96 hours after online publication and is updated daily on week days.
Initial download of the metrics may take a while.