Figure 6
Download original image
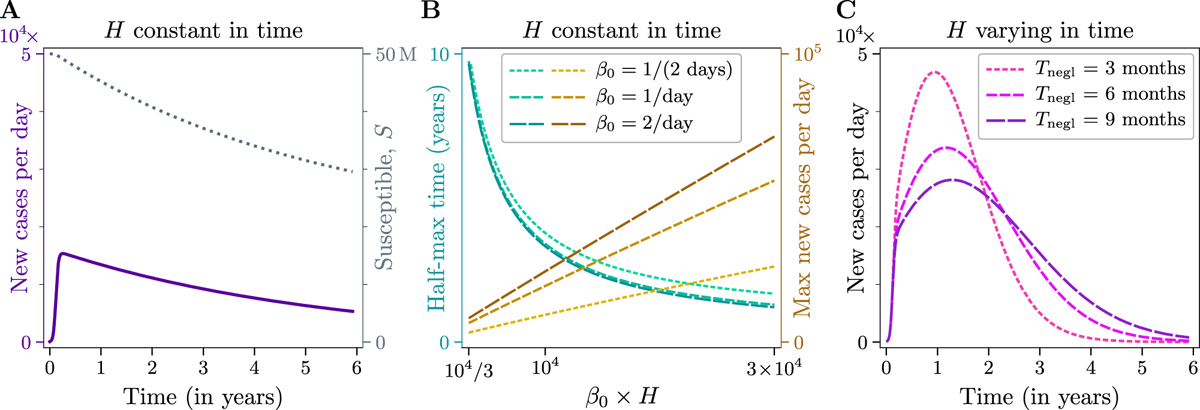
Long-term epidemic dynamics with time-dependent contact rate. (A, B) Contact rate reduced in response to the surge in the daily number of cases. (C) Contact rate reduced in response to the surge in the daily number of cases and modulated by the duration of the quarantine. In panels A and C, initial θ = 1.14, which is equal to last-week θ for Italy. In all panels, population size N = 50 million and R(t = 0) = 500.
Current usage metrics show cumulative count of Article Views (full-text article views including HTML views, PDF and ePub downloads, according to the available data) and Abstracts Views on Vision4Press platform.
Data correspond to usage on the plateform after 2015. The current usage metrics is available 48-96 hours after online publication and is updated daily on week days.
Initial download of the metrics may take a while.