Figure 8

Download original image
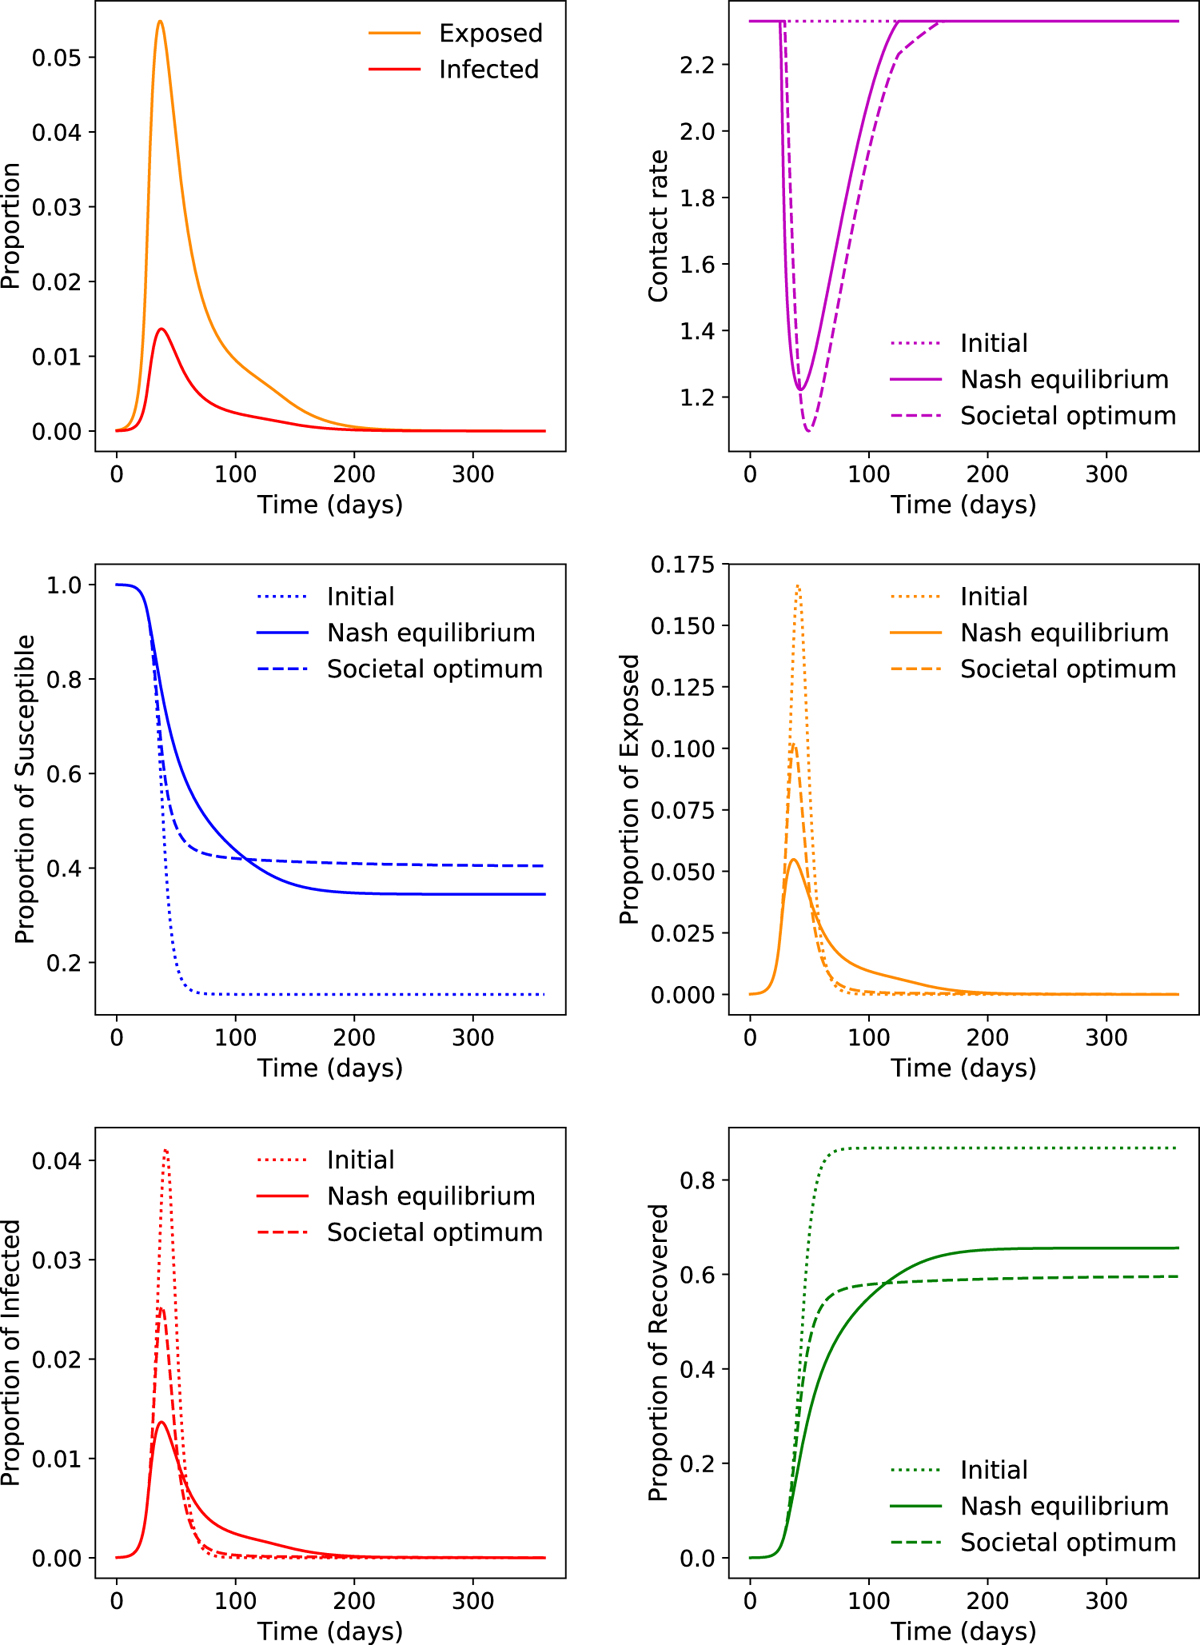
Transmission rate and induced evolution of Susceptible, Exposed, Infected and Recover classes, using the parameters described in Table 2. Solid lines represent the transmission rate and the epidemic evolution at the Mean Field Nash equilibrium, while dashed lines model the societal equilibrium. These two equilibria are compared to the epidemic dynamics with constant transmission rate β0 (dotted lines).
Current usage metrics show cumulative count of Article Views (full-text article views including HTML views, PDF and ePub downloads, according to the available data) and Abstracts Views on Vision4Press platform.
Data correspond to usage on the plateform after 2015. The current usage metrics is available 48-96 hours after online publication and is updated daily on week days.
Initial download of the metrics may take a while.


