Figure B.5
Download original image
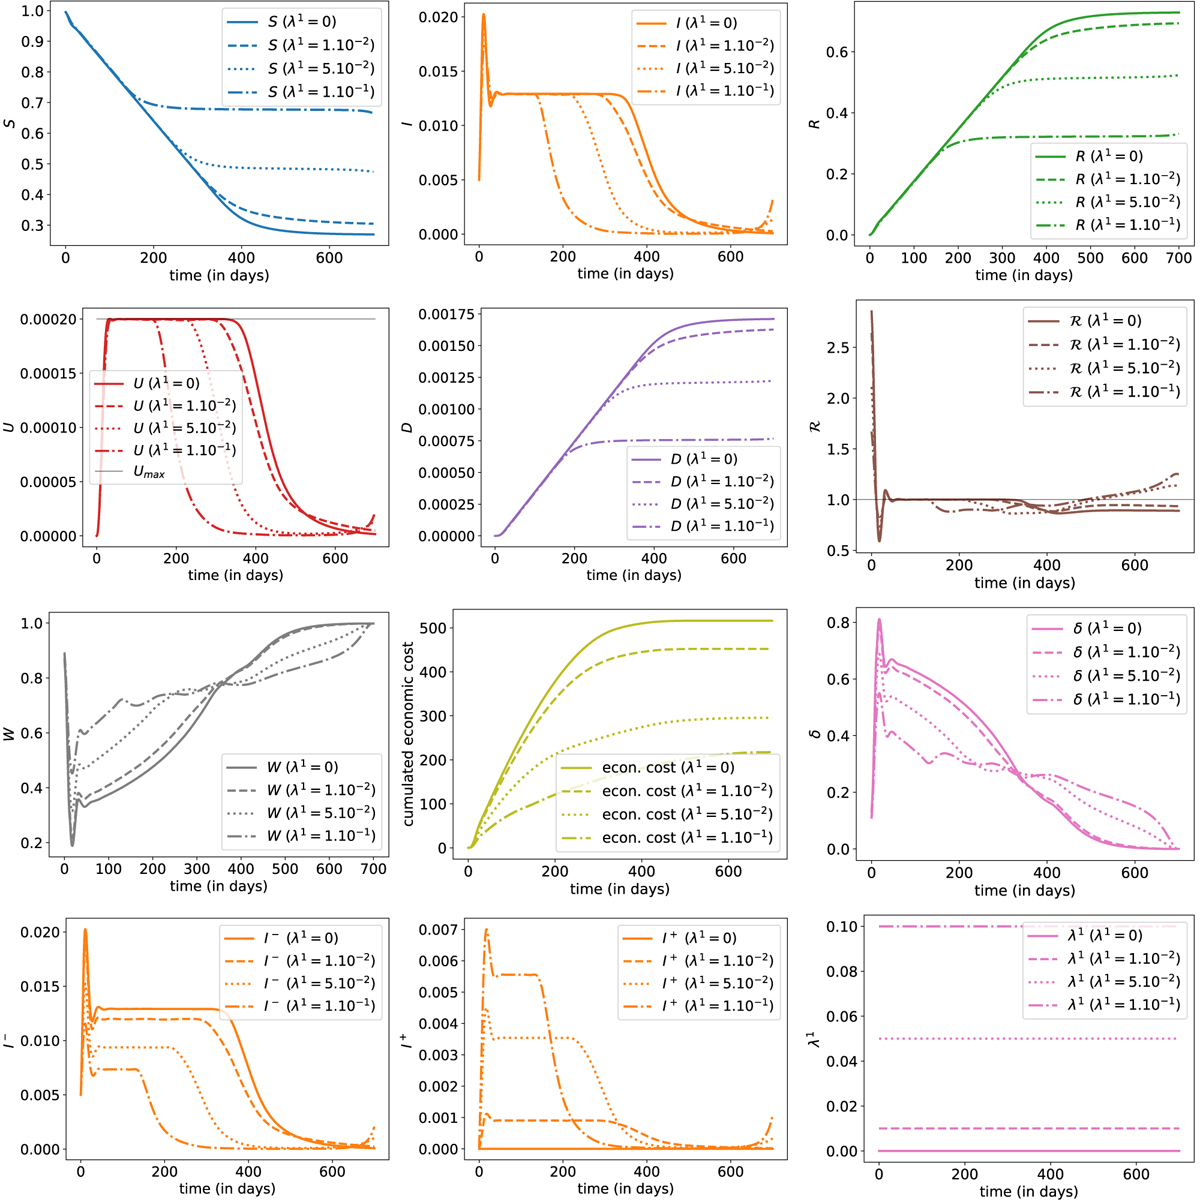
Evolution of states with optimal control δ for three different values of λ1, or (δ*, λ1, 0). The plain line is the benchmark scenario discussed in Section 3.2, with λ1 = 0; and then three scenarios, with λ1 = 1% (dashed line), λ1 = 5% (dotted line)and λ1 = 10% (mixed line).
Current usage metrics show cumulative count of Article Views (full-text article views including HTML views, PDF and ePub downloads, according to the available data) and Abstracts Views on Vision4Press platform.
Data correspond to usage on the plateform after 2015. The current usage metrics is available 48-96 hours after online publication and is updated daily on week days.
Initial download of the metrics may take a while.