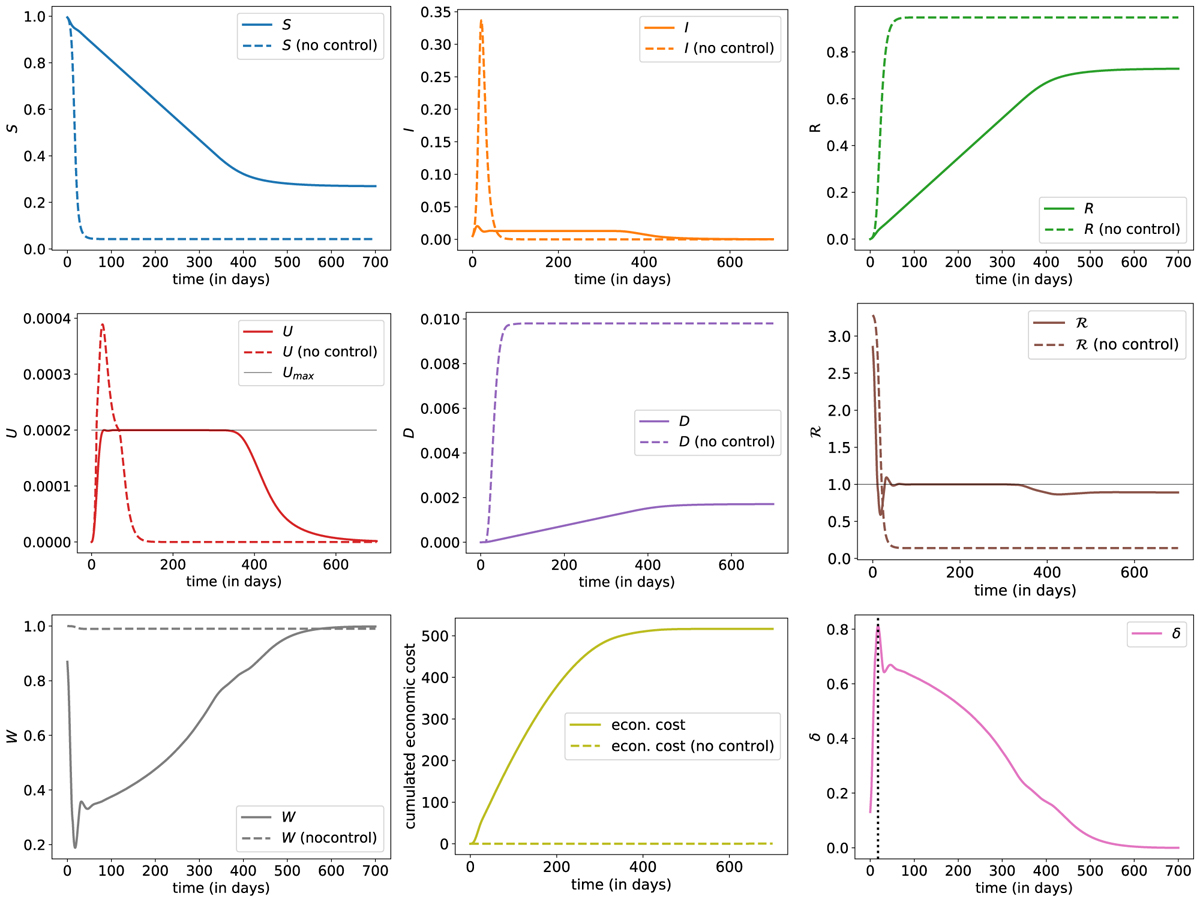
Figure 3
Download original image
Evolution of state proportions – St
(susceptible), It
(infected, detected or not, ![]() ),
Rt (recovered and immune, detected or not,
),
Rt (recovered and immune, detected or not, ![]() ),
Ut (hospitalized in ICU), Dt
(dead), ℜt
(dynamic version of the reproduction number), Wt
(labor force available), Qt
(susceptible to be quanrantines,
),
Ut (hospitalized in ICU), Dt
(dead), ℜt
(dynamic version of the reproduction number), Wt
(labor force available), Qt
(susceptible to be quanrantines, ![]() ) and δt (lockdown intensity) – with optimal control δ
(plain line) and without control (dashed line). States vary here from t = 0 (beginning of the pandemic, or at least of possible measures, with δ ≥ 0) to t = 700, and computations are based on a dt = 1∕5 days.
) and δt (lockdown intensity) – with optimal control δ
(plain line) and without control (dashed line). States vary here from t = 0 (beginning of the pandemic, or at least of possible measures, with δ ≥ 0) to t = 700, and computations are based on a dt = 1∕5 days.
Current usage metrics show cumulative count of Article Views (full-text article views including HTML views, PDF and ePub downloads, according to the available data) and Abstracts Views on Vision4Press platform.
Data correspond to usage on the plateform after 2015. The current usage metrics is available 48-96 hours after online publication and is updated daily on week days.
Initial download of the metrics may take a while.