Figure 5
Download original image
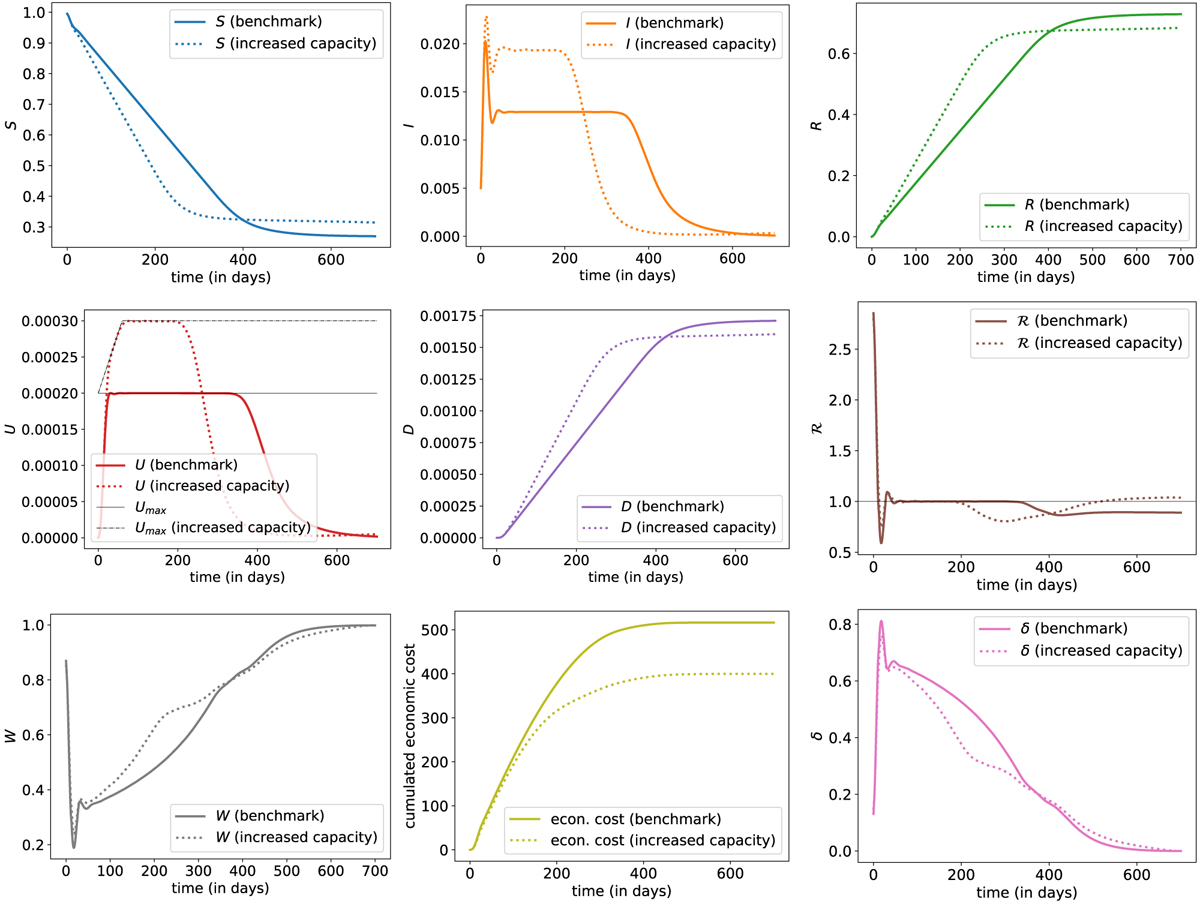
Evolution of states with optimal control δ when ‘raising the line’ (increase of Umax by 50%). The plain line is the benchmark scenario discussed in Section 3.2; the dashed line corresponds to the scenario with a capacity of Umax which increases linearly from time t = 0 until t = 60 days up to 1.5 times the initial capacity and then stays at this level.
Current usage metrics show cumulative count of Article Views (full-text article views including HTML views, PDF and ePub downloads, according to the available data) and Abstracts Views on Vision4Press platform.
Data correspond to usage on the plateform after 2015. The current usage metrics is available 48-96 hours after online publication and is updated daily on week days.
Initial download of the metrics may take a while.