Figure 1
Download original image
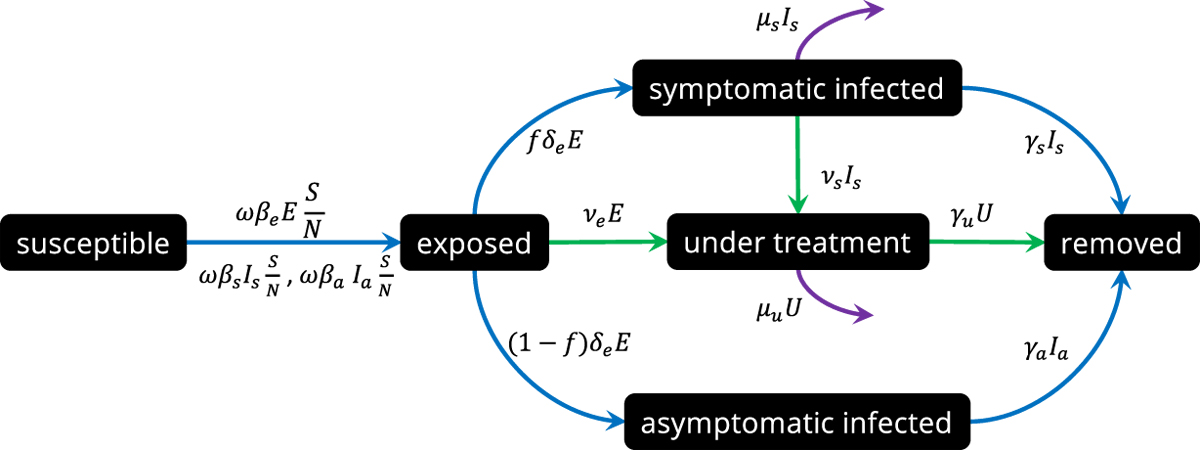
Compartmental representation of the SEIaIsUR−model. Blue arrows represent the infection flow. Green arrows denote for the treatments. Purple arrow is the death.
Current usage metrics show cumulative count of Article Views (full-text article views including HTML views, PDF and ePub downloads, according to the available data) and Abstracts Views on Vision4Press platform.
Data correspond to usage on the plateform after 2015. The current usage metrics is available 48-96 hours after online publication and is updated daily on week days.
Initial download of the metrics may take a while.