Figure 6
Download original image
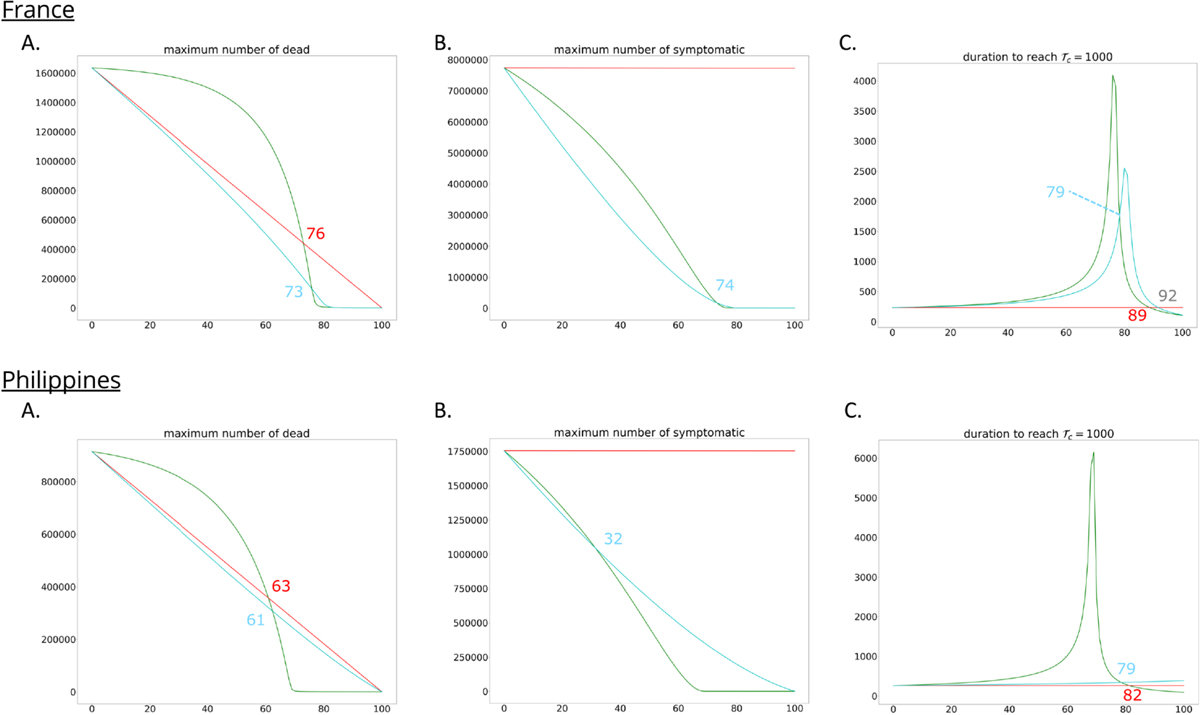
A. Comparison of the maximum number of dead. B. Comparison of the maximum number of symptomatic infected. C. Comparison of the intervention duration to reach
![]() with respect to percentage of containment (green), treatment of symptomatic (red), and treatment of exposed (cyan) for France and Philippines.
with respect to percentage of containment (green), treatment of symptomatic (red), and treatment of exposed (cyan) for France and Philippines.
Current usage metrics show cumulative count of Article Views (full-text article views including HTML views, PDF and ePub downloads, according to the available data) and Abstracts Views on Vision4Press platform.
Data correspond to usage on the plateform after 2015. The current usage metrics is available 48-96 hours after online publication and is updated daily on week days.
Initial download of the metrics may take a while.