Figure 2
Download original image
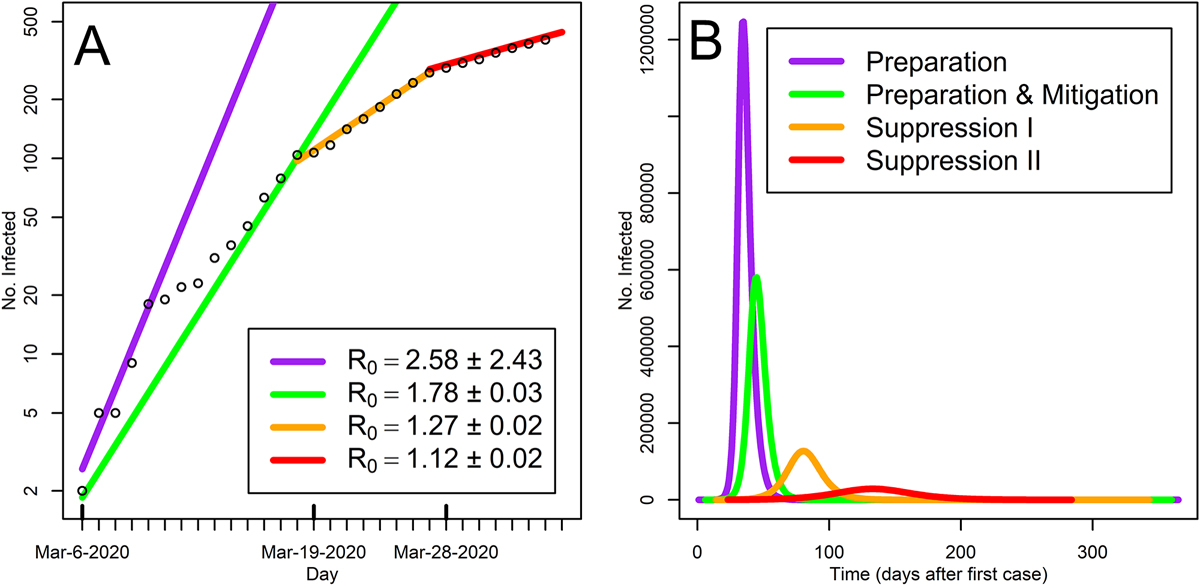
SIR model results. (A) Model fits and R0 estimates ± SE. (B) Curves for the number of infected individuals under different COVID-19 control measures. These curves are presented to illustrate the trade-off that emerges from flattening the transmission curve, where the number of cases at any time decreases, but the epidemic duration increases. In both panels, colors indicate the different control phases presented in Table 1.
Current usage metrics show cumulative count of Article Views (full-text article views including HTML views, PDF and ePub downloads, according to the available data) and Abstracts Views on Vision4Press platform.
Data correspond to usage on the plateform after 2015. The current usage metrics is available 48-96 hours after online publication and is updated daily on week days.
Initial download of the metrics may take a while.