Figure 4
Download original image
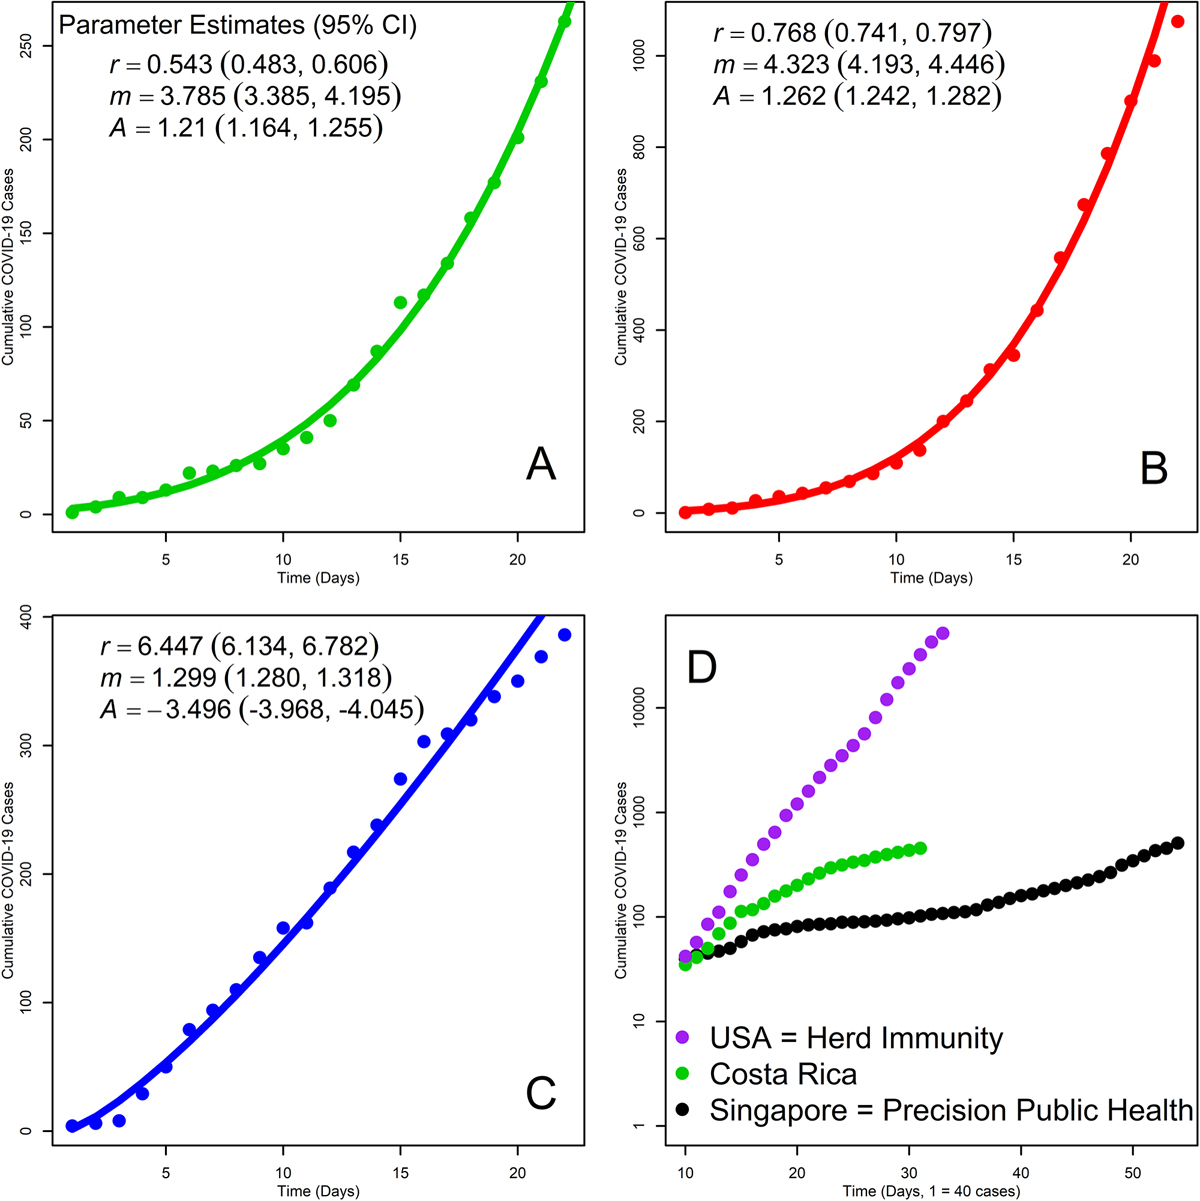
Early epidemic growth curves. (A) Costa Rica, (B) Panamá, (C) Uruguay, (D) USA, Costa Rica and Singapore (y-axis is in log scale, and the first day on the x-axis is when cases approached 40, which in Costa Rica was day 10 after the first case detection). In panels A, B and C curves are based on maximum likelihood parameter estimates, inset in each panel with their 95% confidence intervals, for the early epidemic growth model of equation (4). In panel (D) data from Singapore and the USA were obtained from coronavirus.jhu.edu/data.
Current usage metrics show cumulative count of Article Views (full-text article views including HTML views, PDF and ePub downloads, according to the available data) and Abstracts Views on Vision4Press platform.
Data correspond to usage on the plateform after 2015. The current usage metrics is available 48-96 hours after online publication and is updated daily on week days.
Initial download of the metrics may take a while.