Figure 1
Download original image
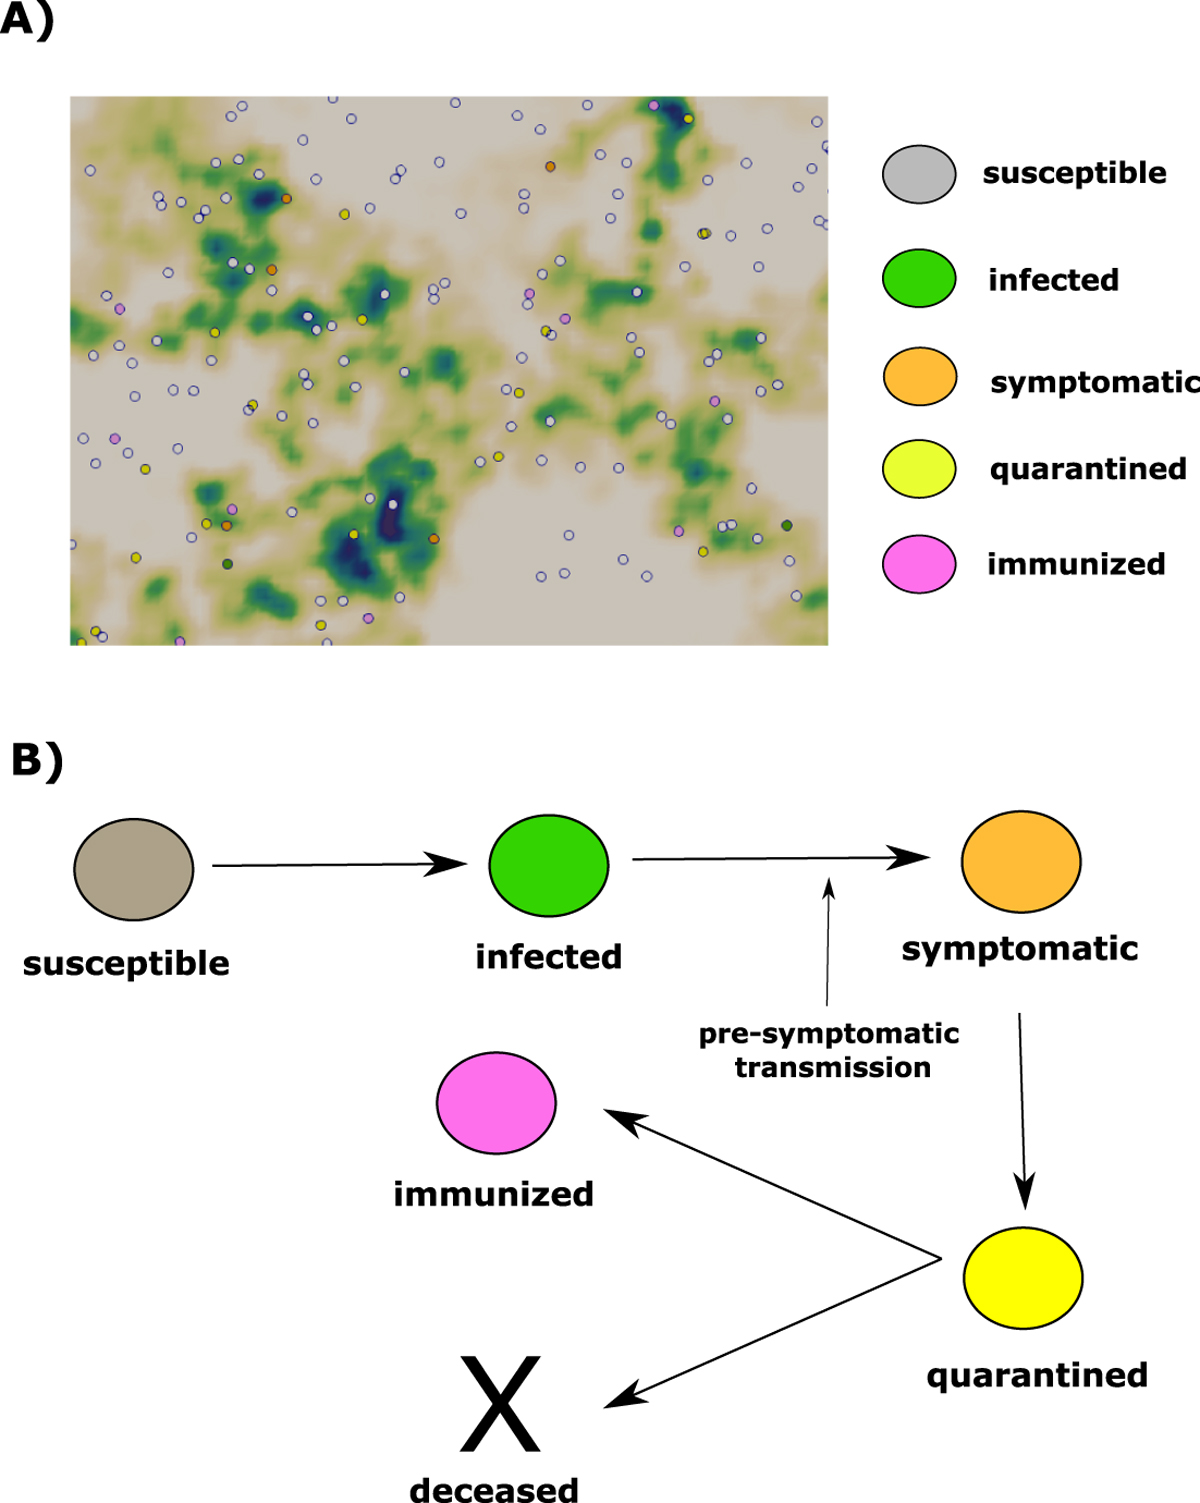
(A) Snapshot of a numerical simulation of the model. Spheres represent agents moving in a square section of 250 m × 250 m. The color of each agent represents the class to which its belong: white for susceptible and immunized, green for infected, orange for symptomatic, and yellow for quarantined. The concentration of stable SARS-CoV-2 on hard surfaces is represented using the gradient of the green color. (B) The clinical course of COVID-19 patients in the model.
Current usage metrics show cumulative count of Article Views (full-text article views including HTML views, PDF and ePub downloads, according to the available data) and Abstracts Views on Vision4Press platform.
Data correspond to usage on the plateform after 2015. The current usage metrics is available 48-96 hours after online publication and is updated daily on week days.
Initial download of the metrics may take a while.