Figure 3
Download original image
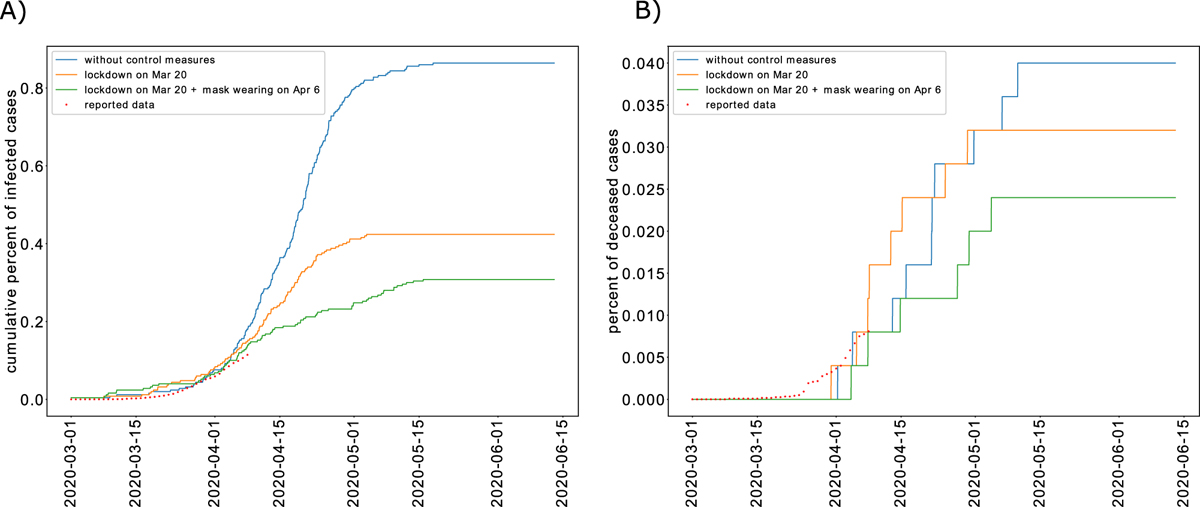
A) The cumulative percent of infected cases over time according to the model predictions for three different epidemic control strategies. The reported data as of April 10, 2020 is shown as well. B) The total percent of deceased agents according to the model predictions and the reported data [15] as of April 10, 2020.
Current usage metrics show cumulative count of Article Views (full-text article views including HTML views, PDF and ePub downloads, according to the available data) and Abstracts Views on Vision4Press platform.
Data correspond to usage on the plateform after 2015. The current usage metrics is available 48-96 hours after online publication and is updated daily on week days.
Initial download of the metrics may take a while.