Fig. 17
Download original image
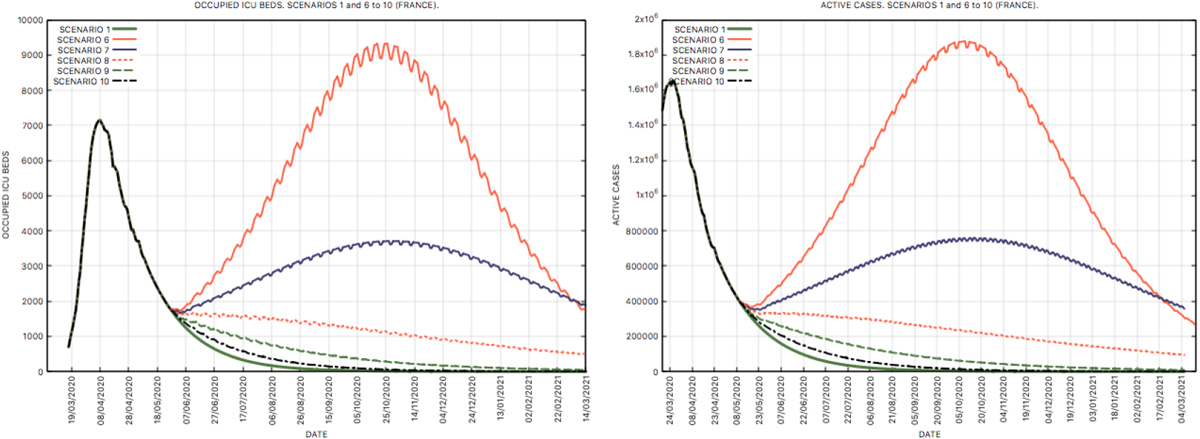
Scenarios 6 to 10: weekly organized deconfinement (France). Left: number of occupied ICU beds (estimated by the model). Right: number of active cases until March 4th 2021 (estimated by the model). Scenario 1 of continuation of lockdown is shown for comparison. All Values up to April 30th 2020 are actual (public data).
Current usage metrics show cumulative count of Article Views (full-text article views including HTML views, PDF and ePub downloads, according to the available data) and Abstracts Views on Vision4Press platform.
Data correspond to usage on the plateform after 2015. The current usage metrics is available 48-96 hours after online publication and is updated daily on week days.
Initial download of the metrics may take a while.