Fig. 7
Download original image
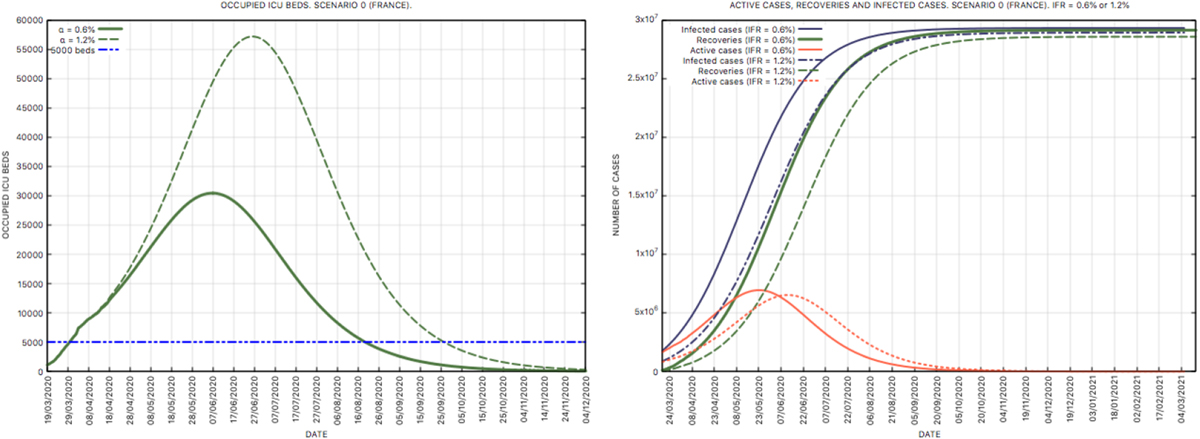
Scenario 0 in France. Left: number of occupied ICU beds (estimated by the model). Right: evolution of the number of active cases, the number of infected individuals and the number of recoveries until early December 2020 (estimated by the model). We observe that the peak of the epidemic occurs at the beginning or end of June 2020, depending on the value of the IFR. Values up to March 17th 2020 are actual (public data).
Current usage metrics show cumulative count of Article Views (full-text article views including HTML views, PDF and ePub downloads, according to the available data) and Abstracts Views on Vision4Press platform.
Data correspond to usage on the plateform after 2015. The current usage metrics is available 48-96 hours after online publication and is updated daily on week days.
Initial download of the metrics may take a while.