Fig. 2
Download original image
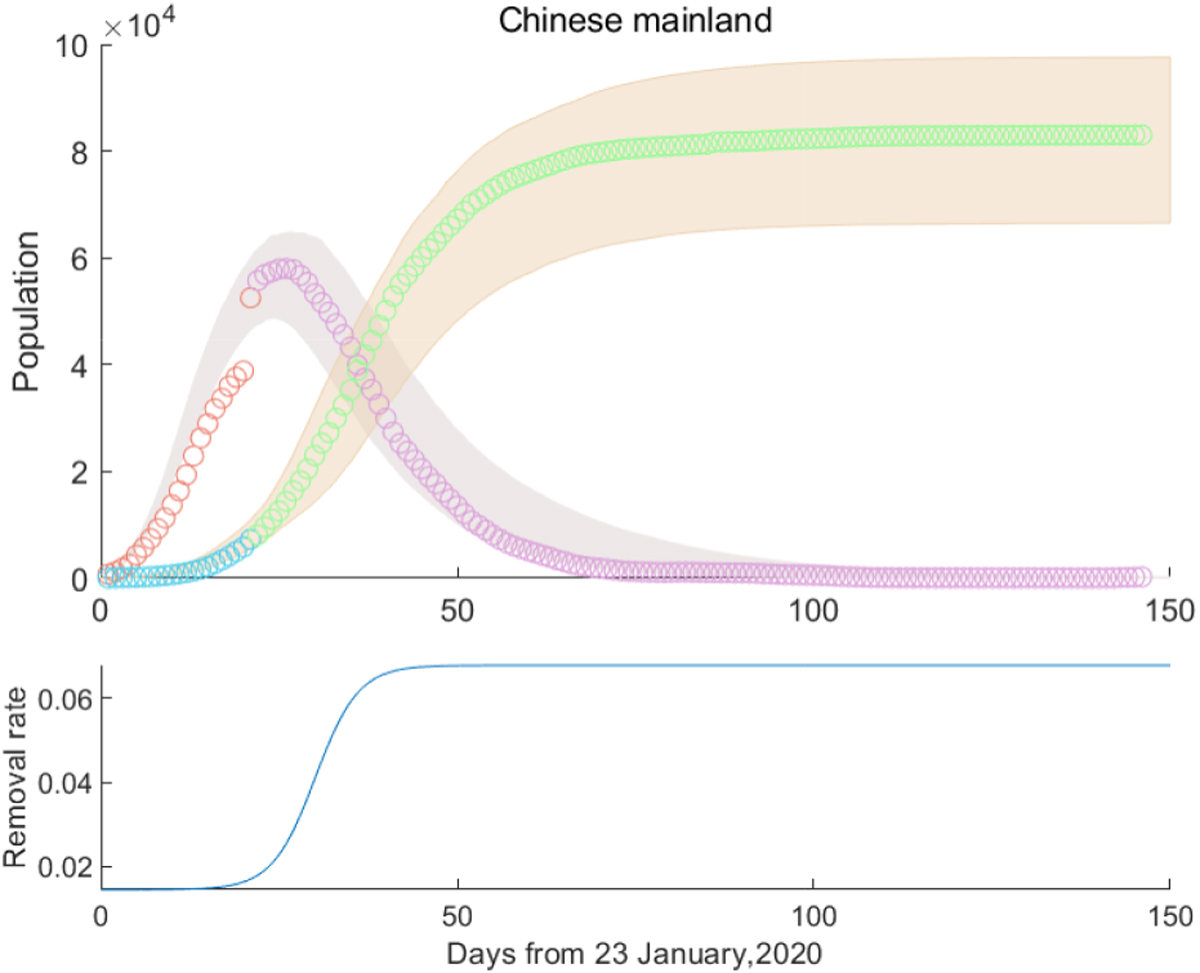
(a) Populations of the quarantined infectious and the quarantined removed individuals as functions of elapsed time since the COVID-19 outbreak in Chinese mainland. The circles represent the surveillance data by the China CDC from January 23 to June 16 with different colors indicating the reported data before and after February 12, and the colored area represents 95% CI of the model prediction using the parameters inferred by Algorithm 1. (b) Inferred removal rate
![]() of the quarantined symptomatic population.
of the quarantined symptomatic population.
Current usage metrics show cumulative count of Article Views (full-text article views including HTML views, PDF and ePub downloads, according to the available data) and Abstracts Views on Vision4Press platform.
Data correspond to usage on the plateform after 2015. The current usage metrics is available 48-96 hours after online publication and is updated daily on week days.
Initial download of the metrics may take a while.